MKX
Virtual Operations Support Team
(MKX-VOST)
Weather
Event Data Capture through Social Media
Introduction
Since the 1970s the US population has moved across
tools like chat windows in private networks to public networks using content
rich sites like MySpace to the current/mainsteam social media tools like Facebook, Vine, Twitter,
Snapchat, Instagram and LinkedIn, just to name a few. What makes life more interesting is we know
there will be many others yet to come.
It is safe to say that most, if not all people
reading this page is a user of a social media tool or two and is most likely a
user of a smartphone or other small form communication device using some level
of paid - access service provided by a wireless carrier.
How do people contact others in these
tools? A bit of irony: current day
smartphone devices are used, for the most part, just about everything other
than phone calls; phone calls have never been a primary use for these
devices. E-mail? passe’ for daily communications. The current state is instant messaging in
some form. Posts to social media sites
or good old text messaging – that is how it has been done for years.
Smartphones have enabled us to become
photographers, news reporters, chronicle our lives and do many other things we
never thought possible. Maintaining
contact with high school and college friends, sharing information with others
who share common interests and even things like work with our medical
professionals on diagnosis and treatment of minor health issues - would those
be possible without the help of smartphones?
To say that five-pack cigar box sized, pancake
thick device we cannot live without has transformed most of our lives is a
simple understatement. Ignore that these
devices and apps exist and watch one’s relevance in the world fade quickly.
Want to engage the public? Social media is THE way to do so. But.. why so many
tools nowadays? The short answer is
niche. According to one source, Snapchat
has been adopted by the (relatively) younger crowd, Twitter and Facebook by the
adult set, Instagram’s user base is predominately female and LinkedIn found a
home in professional networking.
“Like Us on Facebook”, “Follow Us on Twitter”
and many other taglines are common characteristics of our interaction
landscape. Many people “Like”, “follow”
and in the case of the National Weather Service Forecast Offices, contribute observed
data via these tools.
What does that mean for the Weather
Service? The available detail for any
event has risen substantially.
But...does the data received contain the content necessary for use?
Depending on event there may be one, maybe two
useful items out of dozens, or even hundreds of posts. That is a lot of data to “mine” for the value
it provides, and mining of that data takes time away from other things.
Another consideration: what about the posts that never get to the
Forecast Office social media pages? A
data mining exercise in 2014 showed there was a significant amount of valuable
detail being missed due to several factors.
The quality of information was also driven by
the tool used. Free form based tools
like Facebook, while valuable and easier to use, promoted verbosity where may
not needed (or appropriate) where other tools focused on content.
So, in 2015 the Milwaukee Forecast Office staff
responsible for social media outreach determined that because of the “Keep It
Simple” short message, available routing features, advanced analysis and
filtering tools available, Twitter would be a “lead” tool for reporting of
weather information.
But...that approach in itself had some
drawbacks because of the area (square mileage) involved and the keywords used
(weather focused keywords drive some interesting results!) As a result, the staff approached SulCom with a need.
Now for the rest of the story….
Current State
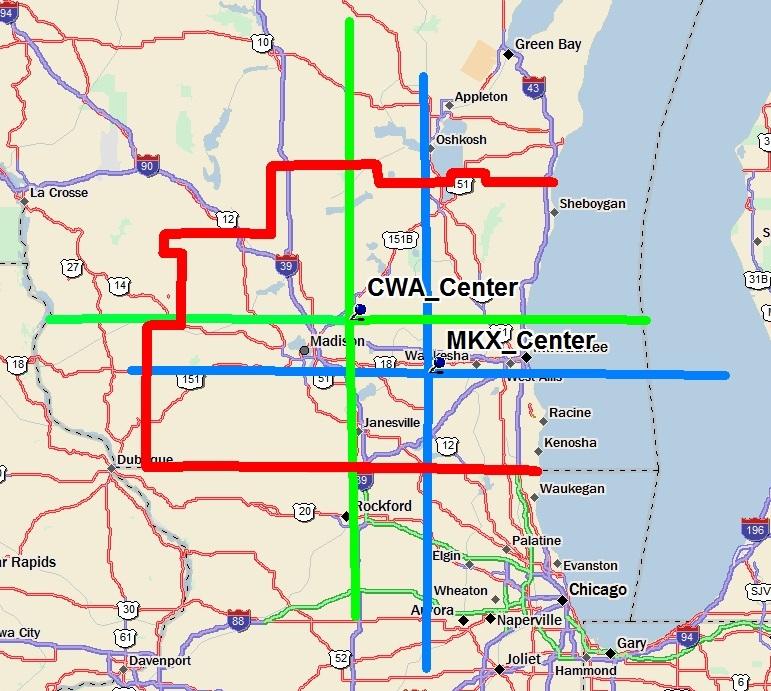
The Milwaukee Forecast Office uses HootSuite for looking at a 100 mile radius for Twitter
posts having keywords like weather, hail, etc.
This is called a “feedwatch.”
As can be seen a “Office (MKX) Center” (blue
lines) and a “CWA Center” (green lines) area does not drive any significant
change in area being canvassed. Either
approach drives areas of capture that are well outside of the CWA (shown in
red.)
The above approach has several disadvantages. Among them being:
1.
Large radius allows for pickup of posts that
are well outside of CWA (though this may be a good thing depending on the
location of the posts.)
2.
Large radius does not allow for
focus/granularity of where posts are coming from in an efficient manner.
3. Posts may, or
may not be related to desired subject matter based on keywords used.
4.
The disadvantages above are not exclusive of
each other, meaning that they feed from each other in compounding of the issues
noted.
So, the above approach creates significant
noise in the office’s Hootsuite feedwatch and
requires analysis that does not generate value.
Future State
So, some thought was given to the
drawbacks. All pointed to the size of
the feedwatch footprint being the root cause.
But...Twitter tools and messaging features
still provide for better analysis opportunities than any other mainstream
Social Media tool for this purpose.
Short and sweet is really what is required.
So, with the above in mind, what can be done?
How about making the search areas more granular
(smaller) and use volunteers to watch the areas?
Some advantages to this:
A individual volunteer can manage more than one feedwatch/area
Volunteers
can be located anywhere
Next...what is the process?
Plan is to use the Twitter/Tweetdeck
accounts created with pre-established guidance to not only be used as team
accounts for forwarding reports within the intended scope, but also for
Retweeting any other posts that meet criteria.
The Milwaukee Forecast Office has a Hootsuite feedwatch that has only the team Twitter/Tweetdeck account handles in them and will parse the
reports originating from the team along with the Retweets via the team (as long
as the content being retweeted meets the needs of the program being supported.)
See below, and the next diagram.
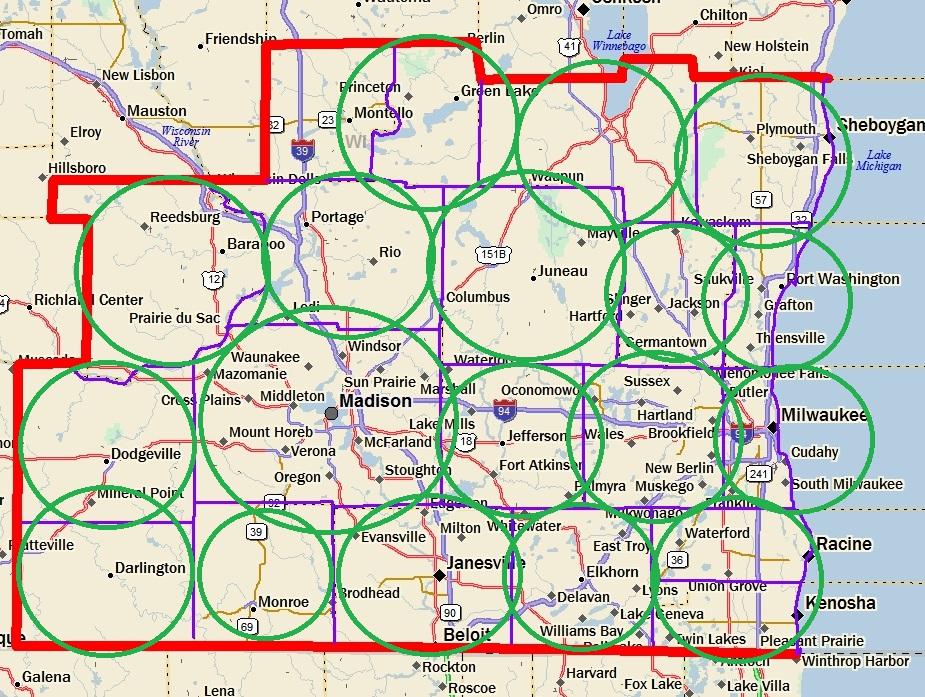
NOTE:
The map above is only an illustration. There are currently eleven (11)
teams in SulCom.
Above
is the estimated coverage of the eleven (11) current teams in SulCom. Gaps can be
seen in the NE and SW portions of the CWA.
Setup
1. Twitter account creation is handled by the
forecast office or program management.
This allows the recipient (in this case the Milwaukee Forecast Office)
to understand the general location of the content.
2. Geocoding and keyword search strings for Tweetdeck feeds will be created and used for capturing
activity in a given area. This should
adequately parse out the weather observation activity from the general
activity.
3. The volunteer’s twitter account will be
linked/added to the team twitter account created in 1, above. This allows the volunteer to communicate on
behalf of the team twitter account.’
4. The volunteer will set up feedwatches*
in Tweetdeck using the feed parameters developed in
Number 2, above.
*Why “feedwatches” (plural?) A volunteer can watch more than one area and
be set up to forward on behalf of more than one account.
Now for the disadvantage - Tweetdeck
is not available for use on mobile devices.
Process
1. The “Feedwatchers”
If a message containing appropriate/relevant content is captured, the feedwatcher simply retweets the message.
As long as the feedwatcher is retweeting on behalf of the “team” account
then the message will appear on the feedwatch
monitored by the forecast office.
Result
The consumer of the information (the Milwaukee Forecast office in this program) receives relevant content to aid in, or validate the decisions they make for a variety of purposes without the need to sift through irrelevant and sometimes inappropriate content. This translates into the forecasters can spend less time analyzing data and more time doing their necessary tasks.